Technical Analysis Guide
What Is Technical Analysis?
A Complete Guide for Traders

Technical analysis is a method of evaluating securities by analyzing price charts, historical data, and trading volume. Unlike fundamental analysis, which focuses on a company’s earnings and financial health, technical analysis helps traders forecast future price movements based on patterns and trends. Whether you're trading stocks, forex, or crypto, technical analysis is an essential tool for informed decision-making.
How Technical Analysis Works

Technical analysis works on the belief that market prices reflect all available information. Analysts, known as chartists, use historical price data and chart patterns to identify trends and market sentiment. The main idea is that price movements are not random and can be predicted through repeated patterns such as support and resistance levels, moving averages, and trendlines.
For more, read Understanding Financial Statements.
Quantitative vs. Qualitative Analysis
Combining Data with Intuition

Fundamental analysis is broadly categorized into two types:
How Fundamental Analysis Works
From Balance Sheets to Decisions
Investors perform fundamental analysis by estimating a company’s intrinsic value using various models and then comparing it to the current market price.
This approach often includes Discounted Cash Flow (DCF) models, earnings forecasts, and macroeconomic evaluations.
Popular Ratios Used
Key Numbers That Define Value
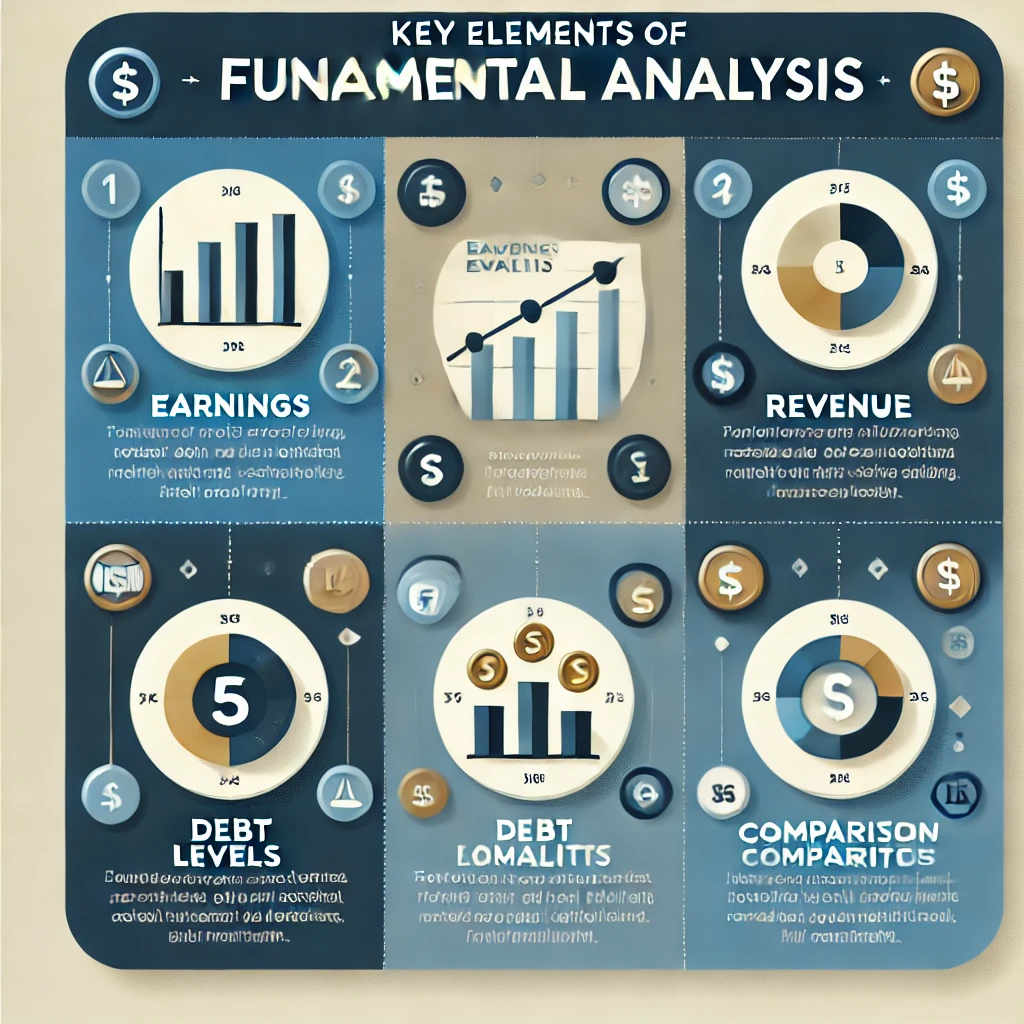
Several financial ratios are widely used in fundamental analysis to measure profitability, valuation, efficiency, and solvency:
- P/E Ratio: Price-to-Earnings (P/E) Ratio Compares stock price to earnings per share.
- PEG Ratio: Adjusts the P/E ratio by expected growth rate.
- Debt-to-Equity Ratio: Indicates the company’s financial leverage.
- Return on Equity (ROE): Measures how effectively a company uses shareholder equity to generate profit.
TThese ratios allow comparisons across companies and sectors.
Explore Top 5 Stock Analysis Tools for more.
Why Fundamental Analysis Matters
Making Confident, Informed Investments
Fundamental analysis provides a logical, data-backed framework for investment decisions. It is ideal for:
- Long-Term Investors: To identify companies with real growth potential.
- Value Investors: To find undervalued stocks with strong fundamentals.
- Risk Management: Avoid investing in companies that appear profitable on the surface but have weak internal metrics.
- Make value-based decisions.
It goes beyond speculative strategies and supports stable portfolio building.
Conclusion
Invest with Confidence
Fundamental analysis remains a cornerstone of smart investing. By focusing on a company's core financial strength and industry position, investors can reduce risk and aim for consistent returns. Whether you're a beginner or a seasoned investor, mastering this approach offers a clear advantage in navigating the stock market with confidence.